
Turning News into Notes for UPSC and Beyond – with Jaiprakash Rau and Anshu Sharma
El Niño is one of the most significant ocean-atmosphere phenomena affecting global climate systems. Its impact extends beyond meteorology into agriculture, economy, society, culture, geopolitics, disaster management, and sustainable development. Super El Niño events intensify these effects and pose major challenges to vulnerable economies like India.
Fig: Climatic extremes associated with El Niño – droughts, heatwaves, storms, and water stress.
1. Meaning and Definition
El Niño refers to the abnormal warming of sea surface temperatures (SSTs) in the central and eastern equatorial Pacific Ocean. It is the warm phase of the El Niño Southern Oscillation (ENSO). The phenomenon weakens trade winds and alters atmospheric circulation globally.
2. Origin of the Term
The term ‘El Niño’ was first used by Peruvian fishermen to describe the warm ocean current appearing around Christmas; hence it was named after the Christ child (‘El Niño’ in Spanish).
3. ENSO System
ENSO consists of:
• El Niño – Warm phase
• La Niña – Cool phase
• Southern Oscillation – Atmospheric pressure see-saw between Tahiti and Darwin.
ENSO is measured through indicators such as Oceanic Niño Index (ONI), SST anomalies, and SOI.
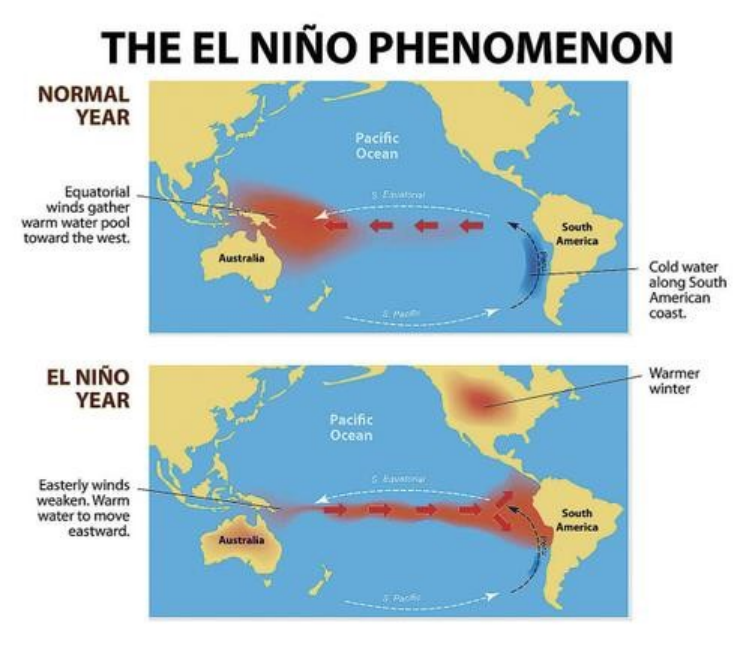
4. Mechanism of El Niño
Normally, strong easterly trade winds push warm surface water westward towards Indonesia and Australia. Cold nutrient-rich water rises near Peru through upwelling. During El Niño:
• Trade winds weaken or reverse.
• Warm water shifts eastward.
• Upwelling decreases.
• Pressure patterns alter.
• Walker circulation weakens.
This causes major disruptions in rainfall and temperature patterns.
5. What is Super El Niño?
A Super El Niño refers to an exceptionally intense El Niño event where SST anomalies exceed +2°C for a sustained period. Examples include 1982-83, 1997-98, and 2015-16 events. These events produce severe global climatic and economic disruptions.
6. Geographical Effects of El Niño
A. Global Effects:
• Droughts in Australia, Indonesia, India, Southern Africa.
• Floods in Peru, Ecuador, and parts of North America.
• Coral bleaching in Pacific and Indian Oceans.
• Increase in forest fires.
• Disturbance in marine ecosystems.
B. Effects on India:
• Weakening of Southwest Monsoon.
• Reduced rainfall and drought conditions.
• Heatwaves in northern and central India.
• Lower reservoir storage and groundwater depletion.
• Impact on Himalayan ecosystems and river regimes.
7. Economic Effects
• Decline in agricultural productivity due to rainfall deficit.
• Reduction in kharif crop output (rice, pulses, sugarcane, oilseeds).
• Food inflation and rise in CPI inflation.
• Increased expenditure on drought relief and irrigation.
• Lower hydropower generation.
• Losses in fisheries due to collapse of nutrient upwelling.
• Global supply chain disruptions and commodity price volatility.
• Insurance losses due to climatic disasters.
8. Social Effects
• Rural distress and farmer indebtedness.
• Migration from drought-prone regions.
• Water scarcity and conflicts over resources.
• Health impacts including heatstroke, malnutrition, and vector-borne diseases.
• Rise in unemployment in agriculture-dependent areas.
• Increased vulnerability of women and marginalized communities.
9. Cultural Effects
• Disruption of agricultural festivals linked to monsoon cycles.
• Decline in traditional fishing practices.
• Stress on indigenous knowledge systems.
• Social tensions arising from resource scarcity.
• Impact on food habits and local cultural economies.
10. Environmental Effects
• Coral bleaching and marine biodiversity loss.
• Increased Forest fires in tropical regions.
• Land degradation and desertification.
• Disturbance in migratory species patterns.
• Intensification of climate extremes.
11. El Niño and Indian Monsoon
India’s monsoon is highly sensitive to Pacific Ocean temperatures. Generally, El Niño weakens monsoon rainfall because:
• Walker circulation shifts eastward.
• Monsoon trough weakens.
• Moisture transport reduces.
However, not all El Niño years lead to drought due to interactions with Indian Ocean Dipole (IOD), Eurasian snow cover, and Madden-Julian Oscillation.
12. Super El Niño and Climate Change
Climate change may increase the frequency and intensity of extreme ENSO events. Warmer oceans amplify atmospheric instability, increasing risks of compound disasters such as simultaneous droughts, floods, and heatwaves.
13. India’s Preparedness and Policy Measures
• Improved monsoon forecasting through IMD and IITM.
• Crop diversification and climate-resilient agriculture.
• Expansion of micro-irrigation.
• Strengthening drought management plans.
• Reservoir management and water conservation.
• International climate cooperation and adaptation financing.
• Disaster-resilient infrastructure.
14. UPSC Prelims Pointers
• El Niño is associated with warming of central/eastern Pacific Ocean.
• ENSO includes atmospheric and oceanic interactions.
• El Niño generally weakens Indian monsoon.
• Fisheries near Peru are affected due to decline in upwelling.
• Southern Oscillation Index measures pressure differences between Tahiti and Darwin.
Prelims MCQ
Consider the following statements regarding the El Niño Southern Oscillation (ENSO) system:
1.During an El Niño event, the Southern Oscillation Index (SOI) captures variations in atmospheric pressure differences between Tahiti and Darwin. 2.The Sentinel–6 Michael Freilich satellite tracks Kelvin waves and rising sea surface heights as a precursor to El Niño development.
3.Every occurrence of a Super El Niño event over the Pacific Ocean inevitably causes severe meteorological drought conditions across the Indian subcontinent.
Which of the statements given above are correct?
A) 1 and 2 only B) 2 and 3 only C) 1 and 3 only D) 1, 2, and 3
Correct Answer: A) 1 and 2 only
15. UPSC Mains Analytical Dimensions
Possible analytical themes:
• Climate variability vs climate change.
• Impact on food security.
• Disaster governance and adaptive federalism.
• Water security and interstate conflicts.
• Climate justice and vulnerable populations.
• ENSO and global economic interdependence.
UPSC Mains Questions
1.El Niño is not merely an isolated oceanic warming phenomenon, but a systemic ocean-atmosphere perturbation that reshapes global circulation cells.” Explain the physical mechanisms behind the weakening of the Walker Circulation during an El Niño event and analyze its downstream impact on the Indian Southwest Monsoon. (15 Marks, 250 Words)
2.Anthropogenic global warming is increasingly blurring the boundaries between natural climate variability and extreme weather anomalies.” In light of recent satellite observations indicating the certain arrival of a historic ‘Super El Niño’, evaluate how compound climatic disasters threaten India’s food and economic security. Suggest proactive policy adjustments to strengthen rural climate resilience. (15 Marks, 250 Words)
16. Interview Perspectives
Possible questions:
• Why does El Niño not always cause drought in India?
• Can India decouple agricultural growth from monsoon dependence?
• How should climate governance evolve under recurring ENSO extremes?
• Is climate-resilient infrastructure sufficient without social resilience?
Analytical Conclusion
El Niño and Super El Niño are not merely climatic anomalies but systemic global disruptions affecting ecology, economy, society, and geopolitics. For India, their significance lies in the deep dependence of agriculture, water resources, and livelihoods on monsoon stability. In the era of climate change, the distinction between natural climatic variability and anthropogenic warming is increasingly blurred. Therefore, India must move from reactive disaster management to proactive climate resilience through scientific forecasting, sustainable resource management, adaptive agriculture, and inclusive governance. A multidisciplinary understanding of ENSO is essential for policymakers, administrators, and civil services aspirants.
17. Recent Scientific Observations and Contemporary Relevance
Recent satellite observations and climate datasets strengthen the scientific understanding of the emergence of Super El Niño conditions. Advanced satellite systems now monitor sea surface temperature anomalies, ocean heat content, wave propagation, and atmospheric circulation patterns in real time.
- NASA and other climate agencies use satellite-based ocean monitoring to identify warm water anomalies in the Pacific Ocean.
- Sentinel–6 Michael Freilich satellite observations identified eastward movement of warm oceanic waters, which is considered a precursor to strong El Niño development.
- Maps showing SST anomalies, weakening trade winds, and oceanic heat distribution are critical for forecasting monsoon variability and global climatic disruptions.
- Historical comparison with major El Niño years such as 1877, 1982–83, 1997–98, and 2015–16 helps climatologists estimate the severity of future ENSO events.
The inclusion of satellite imagery, climatic maps, and scientific datasets enhances the analytical understanding of ENSO dynamics for UPSC preparation. Such evidence-based approaches help connect physical geography with disaster management, agriculture, food security, climate governance, and global economic systems.
Contemporary Scientific Observation
Super El Niño is certain to happen now, NASA has confirmed. The American space agency said that a swell of warm water hundreds of kilometres wide was spotted in the Pacific Ocean, off the coast of South America, via satellite images. Experts say this is a sure-shot sign that Super El Niño will arrive later this year. Previously, climatologists had flagged the possibility of a monster El Niño arriving this year, which will be nothing like ever seen in the past decades. It is predicted to be on the same scale as the one seen in 1877, the worst one ever recorded since data keeping started. Scientists say the upcoming Super El Niño will be like looking into the future 10 years later. NASA said in a statement, “Waves of higher, warmer water move eastward across the Pacific Ocean a few months before an El Niño emerges. Several have shown up in 2026 satellite data.” The data was captured by the Sentinel–6 Michael Freilich satellite launched in 2020